Mahoning County GIS Map Viewer
Welcome to the Mahoning County GIS Map Viewer online help. Select a help topic below to get started.
Help Topics
- Header
- Side Bar Tools
- Search Bar
- Coordinates
- Layer Search Tool
- Identify Tool
- Attribute Table
- LAYERS GROUP Map Layers Swipe Layers Time Slider Bookmarks Legend Add Shape File Add Service SQL Query
- TOOLS GROUP Measure Graphic Measure Buffer Anylsis Traverse Go To XY Geolocate Pictometry Google Street View Draw Graphics Mailing List
- LOGIN GROUP Department Login
- PRINT/EX
- Information
- PORT GROUP Print Parcel Report Save Session Share Maps Export Data
- Common Questions
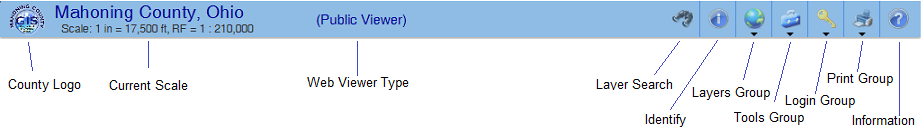
Header
Side Bar Tools
To be Completed.

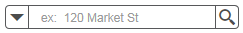
Enter a place-name, address, parcel ID or a keyword in the search box, you see suggestions as you type. If you see an arrow in the search box, you can search on all sources, or click down arrow and choose a specific locator or layer from the drop-down list to perform the search request.
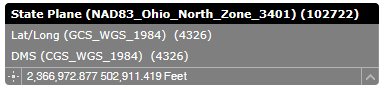
Coordinates
The Coordinate widget displays x and y coordinate values on the map. With the default coordinate system of "State Plane (NAD83 Ohio North Zone 3401, WKID 102722". The coordinate values change dynamically when the mouse pointer moves to different locations on the map. The spatial reference can be changed and the coordinate values displayed based on the spatial reference you select.
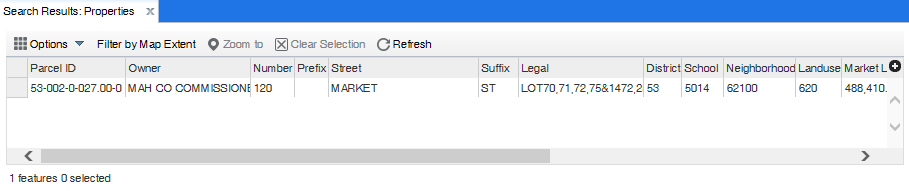
Attribute Table
The Attribute Table widget displays a tabular view of operational layers' attributes. It displays at the bottom of your web application and can be opened, resized, or closed. When more than one layer's attributes display, multiple tabs automatically generate in the attribute panel allowing you to switch among the attribute tables. You can use the widget's configuration window to specify which layer or layers are included in the tabular view, which fields show, and if the tabular view can be exported.
 Layer Search Tools
By Attribute
The By Attribute view has a dropdown list of predefined search layers. Selecting a search layer updates the dropdown list of search aliases for that layer (search expressions):
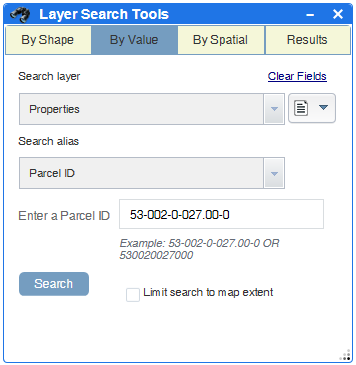
- If the search was configured to use Unique then a dropdown list will be presented of all unique values for the configured field. A progress indicator will be presented to show that the widget is busy working with the unique values as highlight in the image above.
- If Ask for values is specified at configuration time, a text box displays prompting you for new value for the parameter. The default value shows in the box initially.
- If you check the Limit results to maps extent. then the search results will be limited to features that intersect the maps current extent.
- If you checked the Value is required to be entered to enable search then the required expression value will be indicated with "*Required".
- If the expression value is defined as unique values or the field has a coded domain then the drop down list will not contain a blank value like it does when the field is not required.
By Shape
The By Shape view has a dropdown list of predefined search layers and draw tools for drawing on the map to search for features that intersect the drawn graphics.
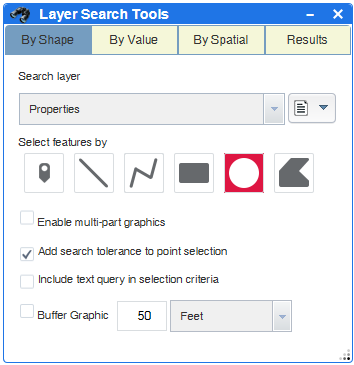
- If you check on the enable multi-part graphics then when you complete drawing on graphic you and can continue to draw the same geometry type and once you have drawn all the graphics you wish to search by then you can click Search to execute the search.
- If you don't check on the enable multi-part graphics then when you complete drawing on graphic the search is automatically executed.
- If you choose the point graphic draw tool and are attempting to search for line or point feature then you should use the Add search tolerance to point selection.
- If you choose you can buffer the graphics after it is drawn but before the search occurs by checking the Buffer Graphic checkbox and adjusting the distance and units if desired.
- If you choose to add or remove from the current search results using graphical searches as well as By Value searches.
By Spatial
The By Spatial view has buffering options, a dropdown list of predefined search layers and spatial operation buttons.
 |
- If have already completed an attribute or graphical search then you can use the spatial search to search for other features that have a spatial relationship to your previous search results.
- If you click the Apply Buffer button than a buffer will be added around your existing search results. This buffer can be used as the geometry of your spatial search instead of the existing search results geometries.
- Choose the layer that you will search for the spatial relationship with your existing search results or buffer.
- Finally select the spatial relationship button that you want to execute. (i.e. entirely contained in).
-
A common workflow for using the By
Spatial search
would be to search for a parcel and determine the
parcels that are within 1000 feet of the original
parcel. To do this you would follow these steps:
- Search the properties layer by Parcel ID using the By Attribute Search.
- Switch to the By Spatial view and buffer that result by 1000 feet.
- Select the properties layer from the drop down layer list and click the intersected by button.
Results
The Results view displays the features returned from the search, and use an alternating color scheme.
 |
- Click on an individual search result will zoom the map to that result and display the popup for that result.
- If the results layer has links configured than the link text or link image will appears in the results.
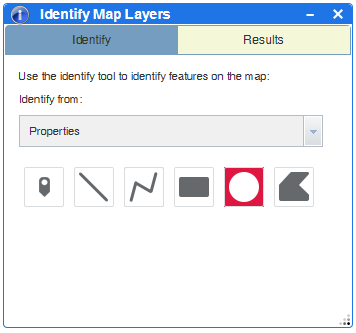
 Identify Map Layers
Another way to query layers is the Identify icon on the toolbar. This tool will query visible layers, set in the Layer List, and produce a dynamic result that accesses pre-defined fields of a particular layer.
 LAYERS GROUP
Map Layers
The Layer List widget provides a list of operational layers and their symbols, and allows you to turn individual layers on and off. Each layer in the list has a check box that allows you to easily control its visibility. Layers having expansion arrows indicate that they contain sublayers or subtypes. The order in which layers appear in this widget corresponds to the layer order in the map. This widget provides functionality allowing you to change the order of layers in the map.

Swipe Layers
The Swipe widget enables you to easily compare the content of different layers in a map. It provides horizontal, vertical and spotlight view modes. You can slide the swipe tool or move mouse around to reveal the content of another layer. For example, you may want to use it to show differences in aerial photography, or display two related thematic layers in a map.

Time Slider
The Time Slider widget will graphicaly display all Parcel Layer transactions between the years of 2005 to the current year. You can control the animation of the data with buttons to play/pause, go to previous time period, and go to next time period.

Book Marks
The Bookmarks widget stores shortcuts to different map locations and zoom levels. Several areas are provided as preloaded bookmarks. Additionally, when a location is discovered that a user will want to return to, this tool can be employed. Simply click the tool, and it opens the Bookmarks dialogue on the left side of the screen: Click the Add Bookmark button, then type in a name for the bookmarked area. This bookmark will be saved in your browser cache, is not permanent. Clearing browser cache will restore the preloaded bookmarks and remove any user-created bookmarks.

Legend
The Legends widget displays the symbology of map layers that have been selected to be visible in the layer list.

Add Shape File
The Add Shape File widget will add a zipped ESRI shape file to the map display. The shape file will not be saved to the layer list for future sessions.

Add Service
The Add Service widget will add a hosted ESRI Map Service file to the map display. The Service file will not be saved to the layer list for future sessions.

SQL Query-Beta
To be Completed.

TOOLS GROUP
Measure
The Measurement widget allows the user to measure the area of a polygon, length of a line, or find the coordinates of a point.
Point measurements
Click the point measurement icon Point measurement icon and click a point on the map. The Measurement widget displays the coordinates for the point in Degrees (decimal). You may change the coordinate display format to degrees/minutes/seconds by changing the Degrees drop-down to DMS.
Polyline measurements
Click the polyline measurement icon Polyline measurement icon and draw a polyline on the map by clicking two or more points. Double-click to finish drawing the polyline. The Measurement widget displays the total length of the polyline, using the defined Default Length Unit. To change the length unit, select the applicable unit of measure from the Milesdrop-down menu.
Polygon measurements
Click the polygon measurement icon Polygon measurement icon and draw a polygon on the map by clicking three or more points. Double-click to finish drawing the polygon. The Measurement widget displays the total area of the polygon, using the defined Default Area Unit. To change the area unit, select the applicable unit of measure from the Acres drop-down menu.

Graphic Measure

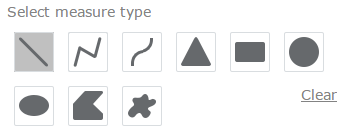
Select Measure Type: Use this portion of the dialog to select which type of shape you would like to draw and measure. The selected tool will be highlighted by displaying a lighter gray background. With a tool selected you are ready to draw on the map. When you have completed drawing the desired shape, no tools will be selected. Clicking the Clear link will remove all measured shapes from the map.
![]()
Preview: Displays what the line or polygon will appear when drawn on the map. As you make changes to the color or size, it will be reflected in the preview.
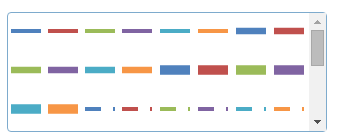
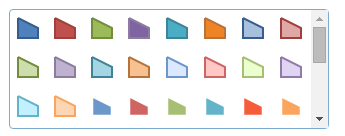
Predefined Symbols: These lists display predefined symbols to give you a good starting point for the shape you are going to draw. You can be more specific about color, line width or type as shown below.
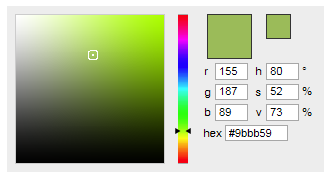
Color, Outline Color, Font Color: Click the associated color box to display a color picker dialog that will let you choose any color. You can be very precise with color values using the RGB, HSV or HEX settings. This will change the color of the line draw, the fill of a polygon or the color of the text used for measuring.
![]()
Transparency: Use the slider to set how transparent a line or or fill will be when a shape is drawn.
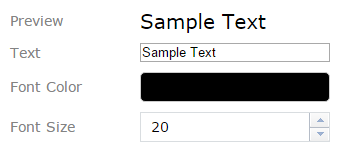
Text Properties: The preview will display what the text will look like for each measure displayed on the map when drawing a new shape. The preview text will also interactively update as a segment is being drawn, as will the Text textbox. You can adjust the size of the text by keying in a numeric value or using the up and down arrows to increase or decrease the size. Clicking the Font Color box will display a color picker that will allow you to choose the color of the text used for measuring.
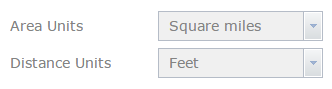
Area Units and Distance Units: Use the drop down boxes to select your preferred units of measure.

Show Measurement Totals: Displays the total of all drawn segments and the area if the draw geometry is a polygon.
Editing Shapes
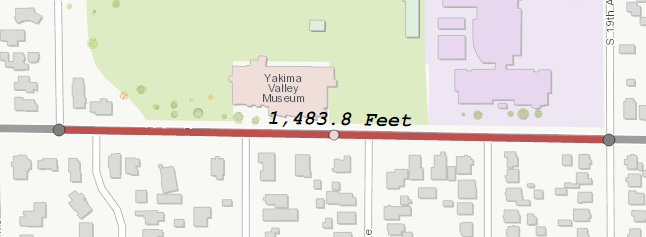
You can edit a drawn shape by clicking or tapping on it. This exposes vertex points that you can drag to new locations. As you drag, the measurements for the segments associated with the vertex will update. When you finish dragging, the summary for total distance and area will also be updated.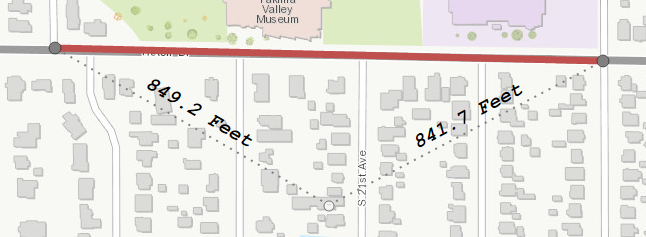
There are two types of vertices. The gray dots represent a regular vertex and the white dots represent a ghost vertex. Dragging a ghost vertex splits the segment into two new segments with new measurements. You can repeat this and create as many vertices as needed for your measurement.
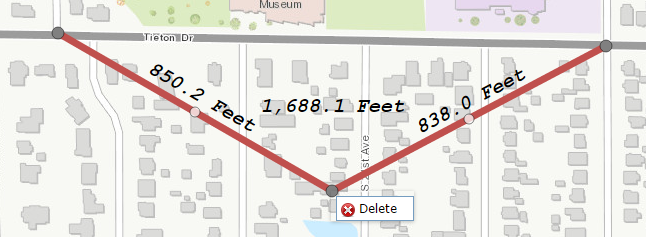
You can delete a vertex by right clicking on it. This will display a delete button. Click the delete button and the vertex will be deleted. The measurements for the drawn shape will be updated to reflect the new segment.
You can also change the properties of the shape. With a shape selected for editing, you can change the line width, line or fill color and line style. You can also change the color and size of the text for the shape selected for editing.
Buffer Analysis
The Buffer Analysis widget allows you to locate point of interest on the map and analyze information from different layers within a specified distance of the subject item.

♦ Click the Buffer Analysis widget icon to open it. The widget
displays at the bottom of the map.
♦ To specify a buffer distance of interest, drag the slider or
manually input a value and press the enter key.
♦ Locate an item on the map by using one of the Buffer drawing
tools. Click the clear buffer icon to clear the current buffer.
♦ Click other tabs�Fire Stations, Hospitals, Librarys, etc to
view the analyzed information for specified layers. You can scroll
the widget panel horizontally to view additional
results.
♦ Optionally, click the number icon to zoom to the feature.
♦ Optionally, click DOWNLOAD CSV to download analyzed data as
a CSV file.
Traverse
The traverse widget allows you to create, edit and save a geographic shape based on bearing and distancemeasurements. Course degrees can be entered in decimal degrees or degree minute second formats. Course angles can be quadrants or north azimuth angles. Course distances can be in a variety of units. The traverse can be rotated around the start point. Traverse areas and closures will always be calculated. Once created the traverse can be saved a GeoJSON shape or saved in a structure compatible with ArcMap CoGo or ParcelFabric. Saved traverse files can be loaded and used at a later time.

Go To XY
The Go To XY widget allows you type in a known set of X Y cooridnates and zoom to that location.

Geolocate
The Geolocate widget will locate the nearest address and the associated X, Y location of that address.

Pictometry
The Pictometry button activates the Pictometry tool. Click on a location on the map, a new window will open in a seperate browser. In this browser, a new viewer will load, which displays oblique aerial photography (Pictometry imagery) for the years that it has been collected for Mahoning County. The imagery will be centered where the selection point was placed on the map.
This imagery is similar to Google 45-degree view or Bing Maps Bird’s Eye view, in that it allows you to see the imagery from an angle, and rotate in the four compass directions (north, east, south and west). It is also allows you to zoom in very close on the imagery to a fine scale. You can zoom in and out of the imagery with the mouse wheel, like the main viewer, or click +/- buttons in the upper left of the viewer window. Left-clicking the mouse and dragging the map moves your position, as in the main viewer.

Google Street View
The Street View button activates the Google© Street View™ tool. The mouse cursor will become a Street View pointer icon. Once this tool is activated, when you click on the map, a new window or tab will open in the browser. The Google Street View will open, where you clicked on the map. (If there is Street View for this location available.) MAHGIS is not in any affiliated with or endorsed by Google, and the Street View window functions independently from the main MAHGIS map viewer. This tool is merely shortcut to Street View and the new window behaves as if you navigated to the location manually in Google Maps.

Draw Graphics
The Draw widget enables end users to draw basic graphics and text onto the map. It provides basic sketching and redlining functionality. It also displays some measurements (if configured) for drawn features, such as lengths for lines, and areas and/or perimeters for polygons.


 LOGIN GROUP
To be Completed.
Department Login

 PRINT/EXPORT GROUP
To be Completed.

Parcel Report
The Parcel Report widget is used to create a print of a "SINGLE" selected parcel of land.
The print will generate a graphic of the land parcel and create a tabular list of the parcel attributes.

Save Session
The Save Session widget is used to save the location and the current layer settings for a particular view of the map.
Muitpal sessions may be saved in order to quickly revert back to a former map view.

Share Maps
The Share widget allows you to share an app by posting it to your social media account, sending an email with a link, or embedding it in a website or blog. It also provides an easy way to define URL parameters for the app.

♦ Click the Share widget icon to open it.
♦ Copy the short link under Share a link to this app and paste it into
your email, instant massage, and so on. You can also use the provided
buttons to post your app to your Facebook, Twitter, or Google accounts,
or in an email.
♦ Optionally click Link Options to easily define URL parameters included
in the short link. See Use URL parameters.
♦ Check the radio button or check box to add a URL parameter from the
following options. You can preview the URL change in the Link preview
box.
♦ Current map extent�This is used by default.
♦ Click the map to define the center of the map with zoom level�A point
icon shows under the option when it is checked. Click the icon and click
where you want the map to center in the app. A point marker will be
added on the map and the URL in the link preview will be updated
accordingly based on the map zoom level.
♦ Click the map to define the center of the map with map scale�A point
icon shows under the option when it is checked. Click the icon and click
where you want the map to center in the app. A point marker will be
added on the map and the URL in the link preview will be updated
accordingly based on the map scale.
♦ Find the location or feature and zoom to it�Input a location in the
box, such as Mahoning County Court House, or a feature in a searchable
layer.
♦ Query a feature and zoom to it�Choose a layer, a field and a value
from the drop-down menus to query a feature and zoom to it.
♦ Add a marker on the map�Click the point icon and click where you want
to add a marker in the map. Fill in the WKID, Pop-up title, Symbol, and
Label properties in each text box.
♦ Overwrite default screen size of mobile layout�Input the screen size
in pixels. By default, when either the height or width of a screen
display is less than 600 pixels, the mobile layout automatically
applies.
♦Set display language of the app�Choose a language from the drop-down
menu.
♦ Authenticate a user automatically�Input a token. By default, your log
in credentials display in the text box when the option is checked.
Click -> to return to the main panel. The short link should be updated
to reflect the URL change made in the step above.
♦Under Embed this app in a website, copy the HTML code and paste it into
your website. If you want, click Embed Options to choose the size of
your app to be embedded.
Export Data
To be Completed.

Information
The Information widget displays various tabs to quickly direct you to the location of documents, links,
and other important information.

Common questions and troubleshooting
♦ The GIS Map Viewer starts but displays a continoius spinning wheel or becomes un-responsive. Sometimes if you leave your browser open for an extended period or for some reason the map does not display even after you refresh or reload the page, clear the browser cache. In Internet Explorer, click on Tools>Internet Options, then click Delete within the Browser History section. In Firefox, click on Tools> Clear Private Data, and make sure Cache is checked. Then click on Clear Private Data Now.
♦ Other browser generated error messages. As a user of this site we ask that you report errors regarding the website via e-mail listed in the Contacts tab of the Information Widget.
♦ Because this site is actively under development, occasionally certain features may not be fully functional until you clear your cache.
Thank you for your patience!